As the election nears, there are more and more polls coming out by the week. Can we really trust everything that we see in polls, or are they just a good publicity tool? There are some important factors that you should pay attention to when viewing polls.
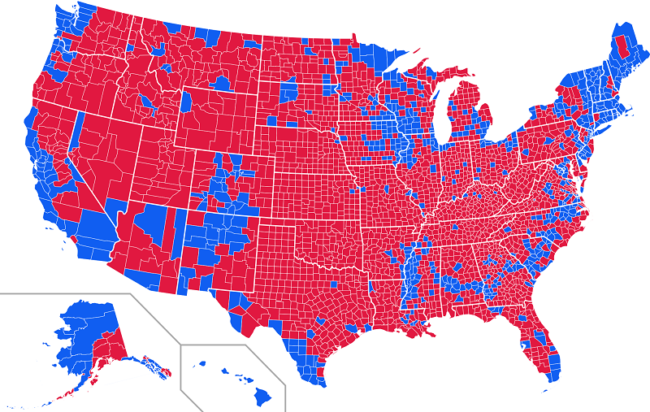
If you tuned in to any news program during the months leading up to November after the nominations were announced, you probably saw a poll saying that Hillary Clinton was going to be elected as the next president. Late on Nov. 8, it became apparent that the polls had gotten it wrong, which prompted questions about the validity of polling. The simple answer: you should still trust polls. But you shouldn’t believe everything that you see in them.
Polls are imperfect, just like the humans who design them. They require things like a sample size, hours of designing unbiased questions, and lots of math that I cannot pretend to explain to you. However, they are still the best imperfect way of predicting election outcomes.
Here are eight things to consider when digesting polling data:
1. Polling size
This is a key statistical category that can help determine the kind of data you get from those you poll. Too small of a sample size and your poll may not reliable, but too large and you have too many results to sort through. For election polls, there is a nice happy medium that resides somewhere between 700-1,200 people surveyed. Most credible polls sit closer to 1,000, but if a poll falls in the distribution, its results usually can be transposed to the larger constituency as a whole.
For example, there was a Vox poll that came out dating Sept. 16-18 that had Beto O’Rourke leading by 0.7 percent. All other factors aside, the sample size was only 508 which makes that kind of data hard to project larger onto the entire population of Texas. It is these polls that you should be especially wary of, for more reasons that are down below.
2. Polling sample
Who a poll surveys is just as important as the sample size. Farther out from Election Day, it doesn’t matter as much if it’s voters, likely voters, or registered voters. Before I continue, let me break down who falls in each category:
Voters are any person eligible to vote which means any 18-year-old or older who is not a convicted felon or ineligible to vote for any other reason.
Likely voters are the same as above, but those who have indicated on the survey that they are likely to vote on Election Day, and are usually the best for polling.
Registered voters are those who are in the voter category, but have officially registered to vote in the upcoming election. While they can be better than a poll of voters only, being registered does not directly translate to actual voting.
But likely voters are the best category. Those who are likely voters are likely to be projectable to the greater public who like them, will most likely vote on Election Day. Because they are likely to vote, their data is also likely to be similar to the breakdown of how voters actually vote on Election Day in addition to more closely mirroring the true voting preferences of the voting district (differs by election).
3. Who conducted the poll
This may be the most important factor, as it usually indicates the innate bias within the polls itself. Just like in network news, everyone in polling has an agenda. Also like taking in network news, it is important to recognize the potential bias of a pollster.
To assist you with this, let’s take two popular news networks and juxtapose them to two pollsters. Take MSNBC and Fox News, both deliver cable news, but MSNBC will have a more critical take on President Trump; whereas, Fox News is more likely to support President Trump. The same is true with polling.
For this, let’s look at Vox and Rasmussen. Vox is a more liberal news publication that also conducts its own polling around elections. Rasmussen is a polling agency that exclusively collects polling data around elections. Vox is more likely to project a more favorable outlook for a Democrat while Rasmussen almost always has the Republican doing better than may actually be the case. This means that polls, just like news networks paint a more favorable picture of the candidate that they favor. When digesting polls, it is important to bear this in mind when looking at the data. To help point out bias in polls, FiveThirtyEight, has a tool that is helpful in pointing out the adjustment from the raw polling data.
4. Polling distribution
This may seem rather self-explanatory, but it is important to look at the percentages that polls give you of support for each candidate. It would stand to reason that the farther apart two candidates are from each other, the less competitive a race might be, right? Not exactly, but it is usually a strong indicator of how a race will turn out. For example, the Utah Senate Race is shaping up to be a landslide victory for Mitt Romney pending political suicide on the part of Romney. However, a state that is a bit more divided, for instance Missouri, is more likely to be decided closer to Election Day, and more reliant on factors such as margin of error.
Margin of error is extremely important when interpreting polling distribution for reasons that I will lay out there. However, the short story is that margin of error creates a potential swing in the polls which means that a close race could potentially flow one way or another depending on how votes are cast at the polling places on Election Day. That means that polling distribution combined with other factors from this list can give you a clearer picture on how a particular race may result.
5. Aggregate your polls
Much like aggregating news can give you a clearer picture, so can aggregating your polls. For this, there are numerous sites that help with this, but my two personal favorites are RealClearPolitics and FiveThirtyEight. If you wish to pay for a service, you could subscribe to The Cook Report, but buyer beware, it is very pricey, and you can get comparable takes from the two free services above.
Furthermore, aggregating polls can be beneficial when you want to look at the trajectory of the race from months back. This can paint many different pictures, but it also gives you an idea of how the race has played out. When examining which seats may flow to the opposite party or be retained by the incumbent, polls can give you an insight if you know how to digest them. When aggregating polls, it is also important to remember the prior four steps so you know how to read into the different polls. At least with FiveThirtyEight, you can view many factors that are helpful for deciphering who the pollster favors, the sample size, and even the margin of error.
6. Voting history of the state
This is easily the most disposable on the list, but I included it because of its bearing to the current Cruz-O’Rourke Senate Race that is taking the country by storm. This really doesn’t matter as much in states like Pennsylvania, Florida, and other “swing states”. The reasoning is that both candidates could theoretically win if they are better than their opponent. Florida Gov. Rick Scott could speak to this as he has been chased out of a restaurant at least once in the past month, and is more likely than not going to lose to incumbent Sen. Bill Nelson.
However, this matters in a state like Texas which has been controlled by Republicans for the past 24 years. I will not deny that Beto is arguably the strongest challenger to a Republican in that span, but it is still a bit unfathomable to think that a Democrat will take over a statewide election during this cycle. That isn’t a jab at Beto so much as it is an assertion that Texas is still controlled by Republicans in enough areas to maintain two Republicans in the Senate through this election cycle at the very least. Another state in the opposite position is New York.
7. The questions the poll addresses (and even the ones it doesn’t)
At least through certain websites, such as FiveThirtyEight, you can view the results page of a particular poll. This can be helpful because it sheds light on what a poll addresses, how it addresses it, and most importantly, what is not addressed. All polls seek to answer a question, usually, which candidate is favored in a particular constituency.
Going back to the Cruz-O’Rourke senatorial race, polls have different ways of measuring support for a candidate. The most recent poll, conducted by Tulchin Research, still puts Cruz ahead although it shows a closer race than other polls. Let’s examine the how to help answer why. In the question, it lists Beto O’Rourke first before Ted Cruz, and then Neal Dikeman before giving an undecided category.
Simply by putting O’Rourke’s name first, it makes it more likely for him to be selected because many humans simply don’t read through all the options, or if they do, there is still an association with the first thing that they read. The same would be true if Cruz or Dikeman had been listed first, so this is not unique to O’Rourke.
However, that is something that poll aggregators like FiveThirtyEight help weigh and adjust the result for. Another way that aggregators help correct polls is by analyzing the leanings of the poll. Tulchin Research is known to lean toward Democrats which is another factor aggregators use to correct the poll.
Finally, no pollster will have a perfect survey. They can unbiasedly phrase questions, present the options fairly, and get sample size and other factors all right, and still not have the perfect poll. That is because a poll cannot ask every question, or nobody would respond.
Polls for the election are designed to help give an indication for who might win a race, so they can’t anticipate every category or question to ask. However, the best ones balance these factors along with their ideology.
8. Margin of error
This is the final and most important step in analyzing polls which is why I saved it for last. Margin of error is often overlooked or shown on a screen, but not addressed. For election coverage of polling, this is a mistake.
Margin of error is the amount of percentage points that a poll could be off, and it allows for wiggle room on both sides. In a recent CNN poll of the Texas Senate Race, there is 52 percent support for Cruz, 45 percent for O’Rourke, and a margin of error 4.5 percent. This means that Cruz could get as much as 56.5 percent of the vote or as little as 47.5 percent of the vote. This is significant because Cruz should be expected to finish somewhere within that margin, and if Cruz ends up on the low side, it would mean victory for O’Rourke.
This is something that coverage of the polls for the 2016 Presidential Election got wrong. It mentioned the margin of error, but discounted the possibility that Hillary Clinton could finish on the low side of the margin. While Cruz should feel confident in his chances to avoid a similar fate to Clinton, he should still feel some pressure since his margin still projects for a potential loss despite a close race.
Next time you view a poll, remember, there is a lot that you can’t actually see, but should know.


